
This article shows a few basic things to make plots better.
1. Imports and Setup
2. Generating Data Points
3. Plotting Data Points
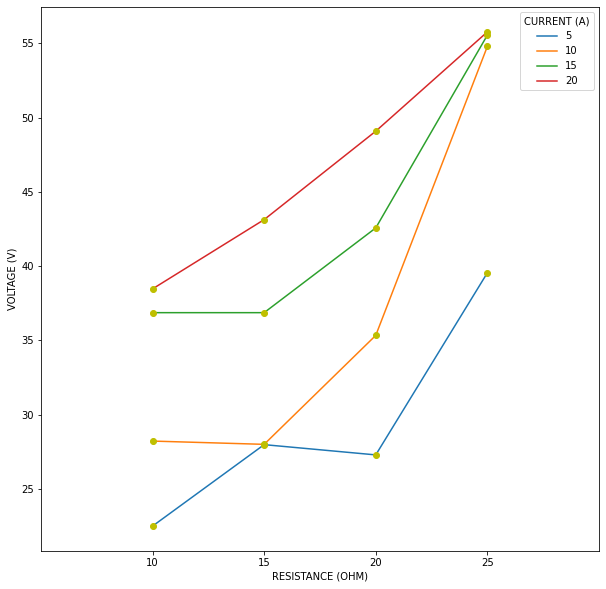
4. Labelling Data Points
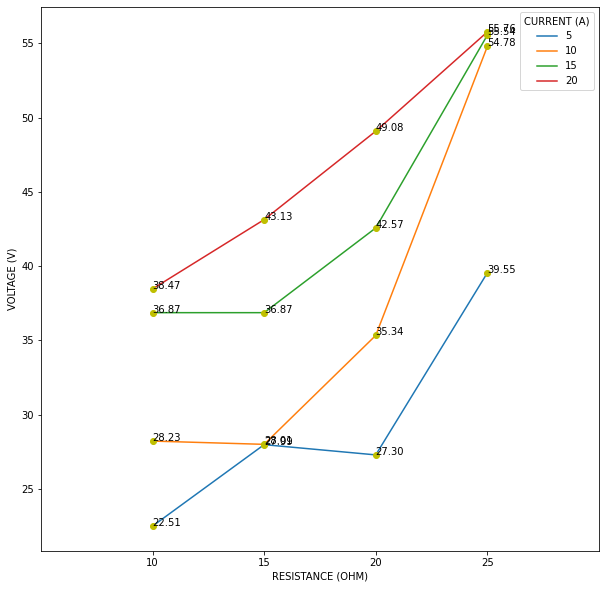
5. Zooming into Dense Regions
We can see that there are two regions which needs to be zoomed into to clearly see the value of the data points.
First let us zoom into the crowded region at the top right corner of the plot.
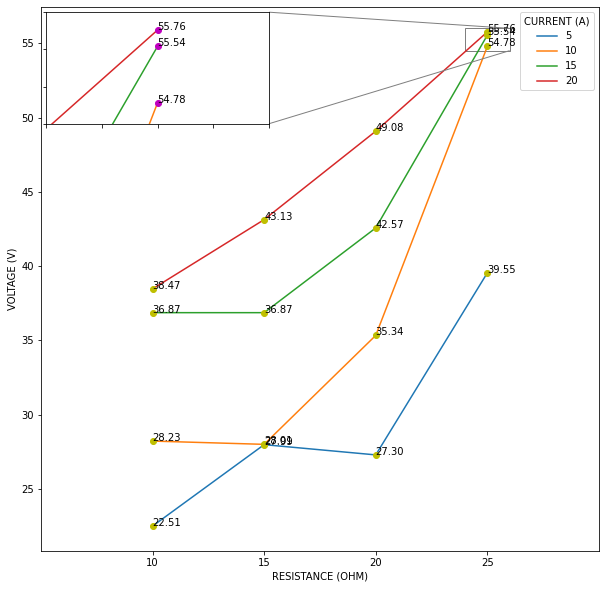
Now, there is still a region in the middle part where it looks crowded.
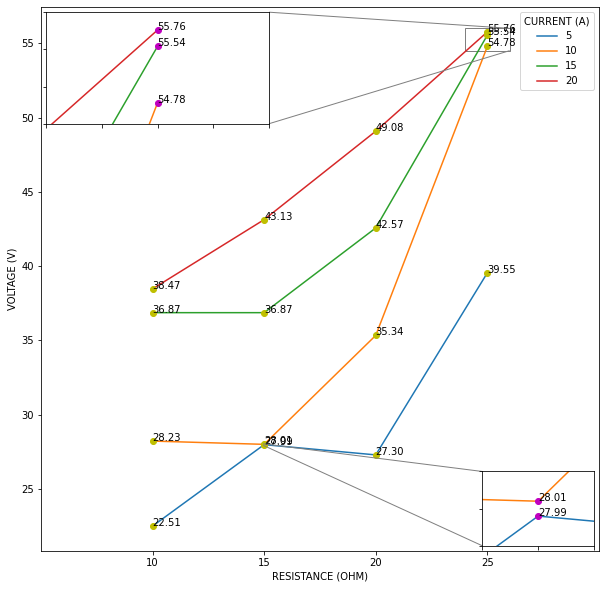
There we have the final plot.
6. 3D Waterfall Visualization
We can create a 3D plot for that. Let’s look at how to do it.
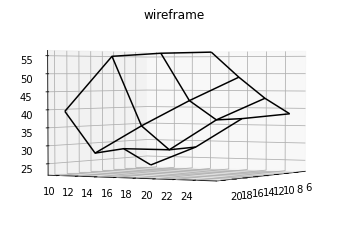
7. Interactive 3D Plot Rotation
We can animate the plot and save it as a video.
https://player.vimeo.com/video/443920619?app_id=122963
Originally published on Medium.